
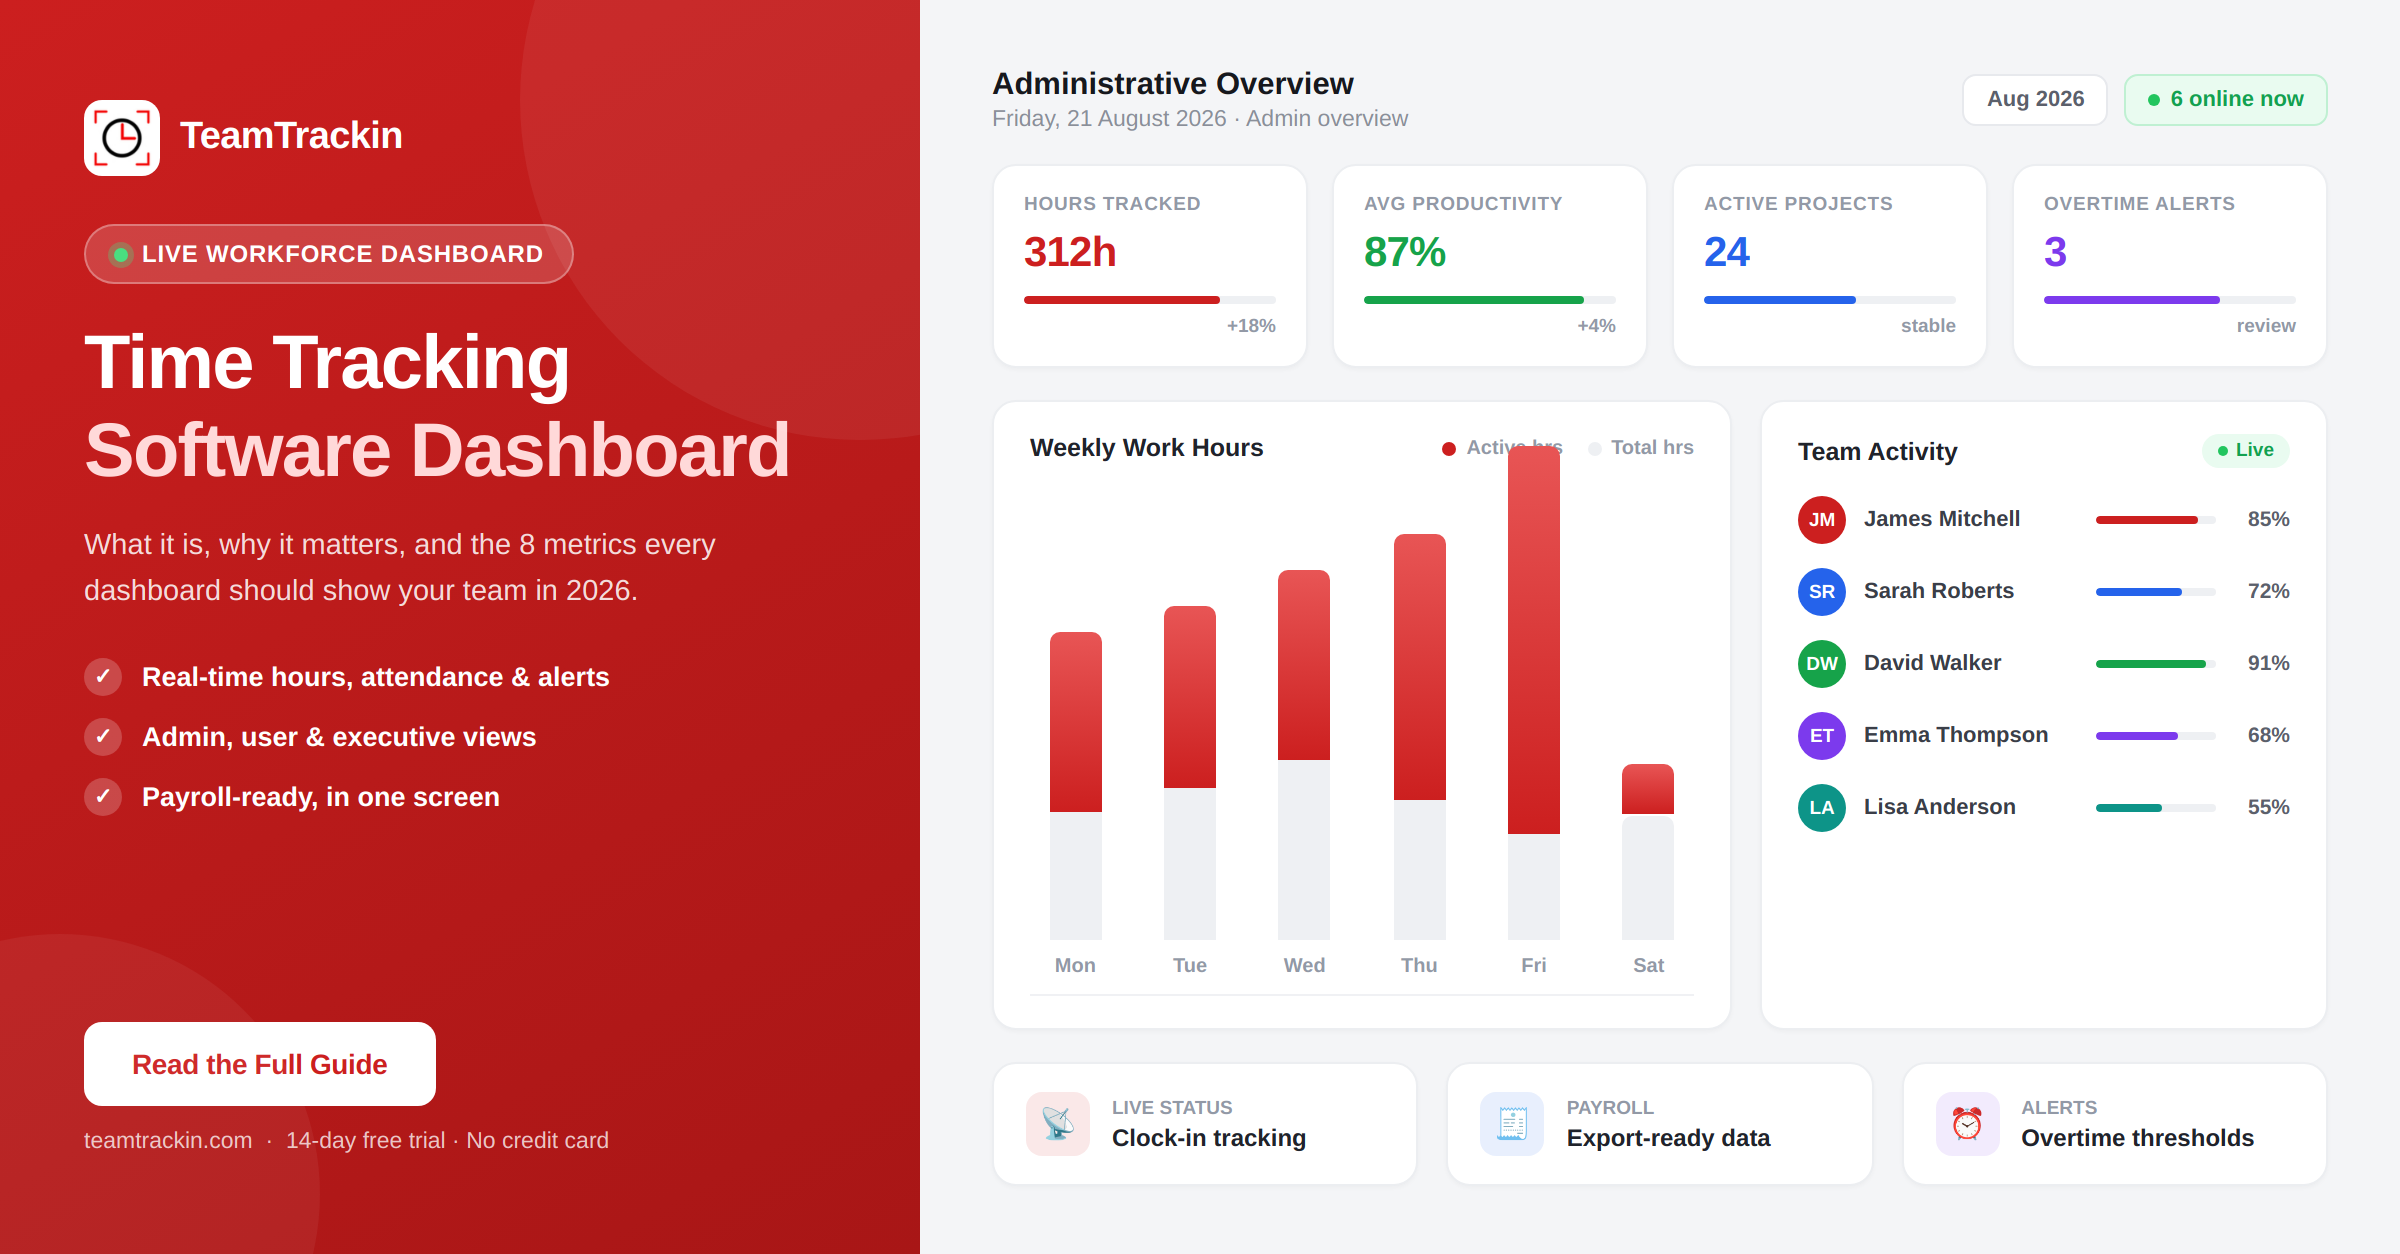
A time tracking software dashboard gives managers real-time visibility into employee hours, productivity, project costs, and attendance — all in one screen. Here's what every dashboard should include, the metrics that actually matter, and how to pick the right one for your team in 2026.
A time tracking software dashboard is a centralized visual interface that displays real-time data about employee work hours, productivity levels, project progress, attendance, and costs — all in one screen. Instead of digging through individual timesheets or spreadsheets, managers get an at-a-glance overview of their entire workforce's activity.
The most important dashboard metrics include: total hours worked, active vs idle time, billable vs non-billable hours, project-level time allocation, attendance status, overtime alerts, and payroll-ready summaries. In 2026, the best dashboards also surface utilization rates, productivity trends, and capacity forecasts — in real time, not in a weekly PDF.
What Is a Time Tracking Software Dashboard?
A time tracking software dashboard is the central screen — usually the first thing a manager or team leader sees after logging in — that consolidates all the critical workforce data into a single, visual overview. Instead of opening five different reports, exporting CSVs, or scrolling through individual employee timesheets, a dashboard presents the information that matters in real time: who is working right now, how long they have been working, which projects are receiving time, and where potential issues are starting to form.
Think of it as the control panel for your entire team's working day. A well-designed dashboard does not just display numbers — it organizes them in a way that makes the next decision obvious. If someone has not clocked in by mid-morning, you see it immediately. If a project is burning through its allocated hours faster than expected, the dashboard surfaces that before it becomes an overrun. If overtime is accumulating in one department but not another, the imbalance shows up in a way that a pile of spreadsheets never would.
The distinction between a dashboard and a report is important. Reports are retrospective — they tell you what happened last week, last month, or last quarter. Dashboards are operational — they tell you what is happening right now and what needs attention today. The best time tracking software combines both, but the dashboard is where day-to-day management actually happens.
A time tracking software dashboard is a real-time, centralized visual interface that shows managers everything they need to know about their team's hours, productivity, attendance, and project progress — without opening a single spreadsheet.
Why a Dashboard Matters More Than Raw Timesheets
Raw timesheets tell you what happened. A dashboard tells you what is happening — and more importantly, what you should do about it. That difference sounds small, but it changes how managers spend their time entirely.
Without a dashboard, the typical workflow for a manager looks something like this: wait until the end of the week, export each team member's timesheet, cross-reference those hours against projects, manually check for missing entries or overtime, compile that data into something presentable, and then make decisions based on information that is already five to seven days old. By the time you spot a problem — an understaffed shift, a project hemorrhaging unbilled hours, an employee who has not logged time for three days — the damage is already done.
A real-time dashboard compresses that entire cycle into a glance. Instead of spending hours each week on administrative review, you open one screen and immediately see: who is clocked in, who is not, which projects are on track, where overtime is building, and whether the team's actual working patterns match what was planned.
The operational advantage of real-time visibility
The real value of a time tracking dashboard is not about monitoring — it is about responsiveness. When a client-facing project starts running over its estimated hours, you see it on Day 3 rather than Day 15. When an employee has been consistently working beyond their scheduled hours, the trend shows up automatically instead of surfacing during a quarterly review. When half the team calls in sick on the same day, the dashboard shows you the gap in real time so you can redistribute work before deadlines slip.
This is particularly critical for businesses managing remote workforce teams, where you cannot simply look across the office to see who is at their desk. A dashboard replaces that physical visibility with digital visibility — without the invasive feel of screenshot monitoring or keystroke logging.
Timesheets are a record-keeping tool. Dashboards are a decision-making tool. Both have their place, but if you are making staffing, payroll, or project decisions based on data that is already a week old, you are always operating reactively — and that costs more than most businesses realize.
8 Metrics Every Time Tracking Dashboard Should Display
Not all dashboards are built equally. Some show too little — just a clock-in timestamp and nothing else. Others show too much — so many charts and widgets that nothing stands out. The best time tracking software dashboards focus on a specific set of metrics that directly inform the decisions managers actually make. Here are the eight that matter most.
| Metric | What It Shows | Why It Matters |
|---|---|---|
| Total hours worked | Per employee, per team, per day/week/month | The foundation of payroll, billing, and compliance |
| Active vs idle time | Time actively working vs time inactive during a tracked session | Reveals actual productivity without relying on self-reporting |
| Billable vs non-billable hours | Client-facing work vs internal/admin time | Directly affects revenue, profitability, and client invoicing accuracy |
| Project time allocation | Hours spent per project, task, or client | Shows whether projects are on track, over budget, or under-resourced |
| Attendance & clock-in status | Who is currently working, on break, or absent | Immediate operational visibility — critical for shift-based and remote teams |
| Overtime hours & alerts | Employees approaching or exceeding overtime thresholds | Prevents compliance violations and unexpected labor costs |
| Productivity scores | Application usage, focus time, and work pattern analysis | Identifies coaching opportunities and workflow bottlenecks |
| Payroll-ready summaries | Approved hours, PTO, overtime — formatted for export | Eliminates manual payroll compilation and reduces processing errors |
These eight metrics cover the three core responsibilities a time tracking dashboard serves: operational management (who is working, on what, and are they on track), financial management (are we billing accurately, controlling labor costs, and staying profitable), and compliance (are we meeting overtime laws, break requirements, and record-keeping obligations).
If your current dashboard does not show at least six of these eight metrics on its primary screen — without navigating to a secondary report — it is not giving you the visibility you need to manage effectively.
A note on vanity metrics: Some dashboards prominently display metrics like "total logins this week" or "average session length" that look useful but do not directly inform any decision a manager needs to make. Prioritize metrics that lead to action — not metrics that just fill space.
Types of Time Tracking Dashboards
Not everyone in an organization needs to see the same data. A CEO tracking quarterly labor costs has different priorities than a project manager monitoring this week's task hours, and both have different needs than an individual employee checking their own logged time. The best time tracking software recognizes this and provides purpose-built dashboard views for each role.
Why role-based dashboards matter
A common mistake is giving everyone the same view. When an employee opens their time tracker and sees the same dashboard a VP sees — full of organization-wide metrics, team comparisons, and financial data — the experience feels overwhelming and irrelevant. Conversely, when a manager only gets access to the same limited view an individual employee sees, they lack the oversight needed to manage effectively.
Role-based dashboards solve this by showing each person exactly the data they need to do their job — nothing more, nothing less. This is not just a design preference; it has real implications for adoption. Teams are significantly more likely to use a time tracking tool consistently when the interface feels relevant to them rather than cluttered with information meant for someone else.
What to Look For in a Time Tracking Dashboard (2026)
The time tracking software market in 2026 is crowded. Most tools claim to have "powerful dashboards" and "real-time insights," but the actual experience varies enormously once you get past the marketing page. Here is what actually separates a useful dashboard from one that just looks good in a demo.
1. Real-time data, not batch-refreshed data
Some dashboards update every 5 minutes. Others update once a day. If your dashboard says an employee clocked in at 9:00 AM but it is now 2:00 PM and you are seeing yesterday's data, that is not a real-time dashboard — it is a delayed report with a modern interface. True real-time means the data reflects what is happening right now, not what happened at the last sync interval.
2. Actionable layout, not just data density
A good dashboard is not the one with the most charts. It is the one where you can open it, understand the current state of your team in under 10 seconds, and immediately know if anything needs attention. The layout should be hierarchical — the most critical information (attendance, alerts, anomalies) at the top, secondary detail (project breakdowns, trend charts) below.
3. Filtering by team, department, project, and date range
A dashboard that only shows aggregate company-wide data is not useful for a team lead managing eight people across two projects. You need the ability to filter by team, department, individual employee, project, and custom date ranges — without navigating to a separate reports section.
4. Mobile-responsive design
Managers do not always sit at a desktop. If a staffing issue comes up while you are between meetings or traveling, you need to be able to pull up the dashboard on your phone and get the same clarity you would on a laptop. Responsive does not just mean "it loads on a phone" — it means the key information is still readable and navigable on a smaller screen.
5. Alerts and threshold notifications
The best dashboards do not require you to stare at them all day. They proactively alert you when something needs attention — an employee approaching overtime, a project exceeding its time budget, a missed clock-in, or an unusual activity pattern. These alerts turn a passive display into an active management tool.
6. Direct export and payroll integration
If the data on your dashboard cannot be exported directly to your payroll system — or at least downloaded as a clean CSV or PDF — then the dashboard is creating extra work instead of eliminating it. The whole point is to reduce the manual steps between tracking time and processing payroll.
Open your time tracking dashboard. If you cannot answer "Is anything off today?" within 10 seconds, the dashboard is not designed well enough to serve its primary purpose — regardless of how many features it has.
Common Dashboard Mistakes That Waste Time Instead of Saving It
A poorly designed dashboard does not just fail to help — it actively wastes time. Managers end up spending more effort interpreting the dashboard than they would have spent just checking timesheets manually. Here are the most common mistakes that turn a potentially useful tool into another source of friction.
Showing everything, prioritizing nothing
When every metric is given equal visual weight — same size, same placement, same formatting — nothing stands out. A dashboard that shows 25 widgets with no hierarchy is not comprehensive; it is confusing. The most important information (attendance anomalies, overtime alerts, project overruns) should be visually distinct from secondary detail. If everything is "important," nothing is.
Requiring clicks to reach critical data
If a manager has to click through three menus to see who is currently clocked in, or navigate to a separate report page to check overtime hours, the dashboard has failed at its primary job. The metrics that inform daily decisions should be on the landing screen — not hidden behind navigation layers that add friction to every check.
No connection between time data and project data
Many dashboards show total hours worked but do not show which projects those hours are going toward. This is like having a bank statement that shows total spending but not which categories the money went to. Without project-level allocation visible on the dashboard itself, managers have to manually connect two separate data sets — time data and project management data — which defeats the purpose of having a centralized view.
Displaying data without context
A number on a screen means nothing without context. "Sarah worked 42 hours this week" — is that good or bad? It depends on her scheduled hours, her contract, her department's average, and whether those hours were billable or internal. A dashboard that shows raw numbers without comparative context (versus targets, averages, or thresholds) forces the manager to do the interpretation work mentally, which adds cognitive load to every review.
Updating too slowly to be useful
A dashboard that refreshes once a day is a report with a visual interface. A dashboard that updates every few minutes but does not show timestamps is an unreliable report. If you cannot trust that the data you are seeing reflects the current state of your team, you end up double-checking it against other sources — which eliminates the time savings the dashboard was supposed to provide.
If your team leaders are still maintaining their own spreadsheets alongside your time tracking software's dashboard, the dashboard is not meeting their needs. Shadow tracking is a reliable indicator that the official tool is not providing the right data, in the right format, at the right frequency.
See what a real-time dashboard should look like.
TeamTrackin's dashboard shows your team's hours, productivity, and attendance — live.
How TeamTrackin's Dashboard Gives You Real-Time Workforce Visibility
TeamTrackin was built around the principle that a dashboard should make the next decision obvious — not just display data for the sake of displaying data. The platform provides both an admin dashboard for managers and an individual user dashboard for employees, each designed for the specific decisions that role needs to make.
How the data flows
The result is a dashboard that does not just show data — it shows you what to do next. Every metric on TeamTrackin's dashboard is connected to an action: approve this timesheet, investigate this overtime trend, redistribute this workload, export this payroll batch. That connection between visibility and action is what separates a useful dashboard from a decorative one.
Frequently Asked Questions
- What is a time tracking software dashboard?
A time tracking software dashboard is a centralized visual interface that displays real-time data about employee work hours, productivity levels, project progress, attendance, and costs — all in one screen. Instead of digging through individual timesheets or spreadsheets, managers get an at-a-glance overview of their entire team's activity, making it faster to spot issues, approve hours, and make staffing decisions.
- What metrics should a time tracking dashboard show?
The most important metrics for a time tracking dashboard include: total hours worked (per employee and per team), active vs idle time, billable vs non-billable hours, project-level time allocation, attendance and clock-in status, overtime hours and alerts, productivity scores, and payroll-ready hour summaries. The best dashboards also show utilization rates and project burn rates for capacity planning.
- What is the difference between an admin dashboard and a user dashboard in time tracking software?
An admin dashboard provides organization-wide visibility — total team hours, attendance across departments, productivity trends, overtime alerts, and payroll summaries. A user dashboard shows the individual employee's own data — their tracked hours, active tasks, leave balances, and personal productivity metrics. Some platforms also offer an executive dashboard that focuses on high-level KPIs like utilization rates, project profitability, and labor cost trends.
- Why is a real-time dashboard better than weekly reports?
Weekly reports tell you what happened after the fact — by the time you see the data, the week is already over and any staffing gaps, missed shifts, or budget overruns have already occurred. A real-time dashboard lets managers see who is clocked in right now, which projects are receiving time, and where potential issues are forming, so they can act immediately instead of retroactively.
- Does TeamTrackin have a real-time time tracking dashboard?
Yes. TeamTrackin provides both an admin dashboard and a user dashboard with real-time data. The admin dashboard shows live clock-in status, team productivity scores, active vs idle time, project time allocation, overtime alerts, and payroll-ready summaries. The user dashboard gives individual employees visibility into their own tracked hours, tasks, leave balances, and productivity trends — all updated in real time.
Stop guessing.
See your team's real-time dashboard.
TeamTrackin gives you live visibility into every hour tracked, every project in progress, and every decision that needs your attention — try it free for 14 days.
Start Free Trial→14-day free trial · No credit card · Setup in ~3 minutes